

CRM Job Report December 2022
Tracking CRM employment demand, wages & required education
Twin Cairns Intelligence Unit Reports
The Twin Cairns Intelligence Unit will soon begin publishing comprehensive CRM employment and wage reports with granular regional data. Reports will be based on monthly, quarterly, and annual numbers. Reports will be posted on the Twin Cairns Intelligence Unit web page and could be purchased for nominal fees.
Once the Twin Cairns Intelligence Unit begin publishing reports, reports become available, our the regular Twin Cairns Monthly Job Report will revert to publishing reports focusing on national data only.
The number of CRM jobs posted online for December was uniquely high. Over 188 jobs were posted on the Twin Cairns site, almost triple the monthly averages from years past (Fig 1-2).


A Twin Cairns Intelligence Unit data audit – taken as part of transition of data collection and analysis from Twin Cairns – provided for a more consistent and granular data concerning employer type. We now have a dataset that covers the entire FY2022.
Government agencies continued recruiting employees, particularly at the federal level (Fig. 3-4). Within the private sector, engineering firms dominated hiring, with 27% of all job posts. A close second are companies with CRM services only, with 26% of all job posts.


Demand for all CRM position types continued to be strong, particularly for Crew Chiefs and PM/PI’s (Fig. 5). For December, demand for related CRM jobs – GIS Techs, Museum Techs, Historians, etc – was very strong, with 45 different positions offered (a more robust analysis of these jobs will soon be provided by the Twin Cairns Intelligence Unit).

The largest number of jobs were offered for positions in the Southwest & Southeast (Fig. 6). Surprising are the number of jobs offered in the Mid Atlantic (18 positions) and Midwest (16 positions) despite the coming of winter and adverse weather conditions. The strong demand for Crew Chiefs dominated job posts in all regions, and only in the West the demand for PI/PM’s was higher (Fig. 7).


Nationwide, average hourly wages for Field Techs slightly increased in December – from $20.77 to $21.11, a 2% increase from November (Fig. 8). Average wages for Crew Chiefs declined slightly from November (2.3%) and salaries for PI/PM’s continued to grow, increasing by 5.3% from November. The wage gap between Field Techs and everyone else continues to grow, especially against PI/PM wages (Fig. 9).


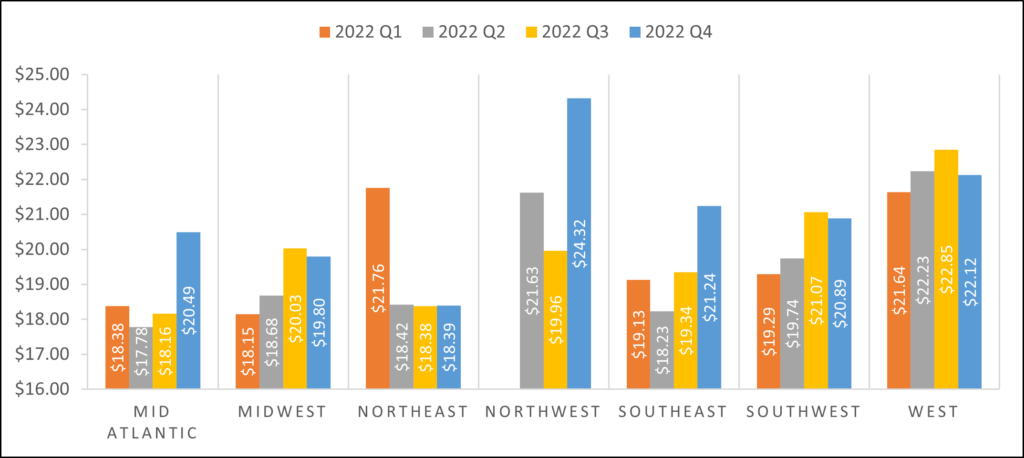
Average Field Tech salary increased in the West, Southeast and Northwest but declined everywhere else (Fig. 10). The lowest Field Tech wages are still being paid in the Northeast.

The number of job posts requiring field school for Field Techs slightly increased to 57% (Fig. 11). The field school requirement is weakest in the Southwest, Northwest and West but this just may be a data anomaly given how few Field Tech positions were published for these regions (Fig. 12).


Employers are publishing wage information for three-quarter of all job posts (Fig. 13). This is a decline from November, a result of more private sector jobs posted in this month. All state positions publish wage information, while not all private sector jobs posts include information about wages (or benefits).

Summary
In an article published by the Wall Street Journal on January 1 (2023), a chart illustrates nationwide average salary increases for 2022 compared to consumer-price index (Fig. 14). The average hourly earnings increase, in the private sector, was just slightly over 5% monthly. Between Q1 and Q4 of 2022, Field Tech wages increased by only 3.6%, while those of Crew Chiefs and PI/PM’s increased at a much higher rate (Fig 15). Field Tech wage increases are trailing not only inflation, but also national averages.

| Quarter | Field Tech | Crew Chief | PM/PI |
| 2022 Q1 | $20.36 | $23.86 | $32.83 |
| 2022 Q4 | $21.09 | $27.79 | $41.25 |
| Change (%) | 3.6% | 17% | 26% |
Why are these wage discrepancies? Some may be attributed to regional differences, were severe wage depression in the Northeast drags down wage data for the national level (Fig. 16). It may also be possible that as weather worsen in the northern U.S., Field Techs migrate to southern latitudes and wage increases for Q4 in the West and Southwest stop, while the Southeast is catching up and the Northwest is trying to temp Field Techs to stay in the region through record wages.
It may also be that the scarcity of Field Tech force firms to invest heavily in retention of existing employees. Data from the Federal Reserve Bank of Atlanta suggest that employers are investing in employee retention at rates and pace never recorded before (Fig. 17, see “Job Stayer”). This allow employers to save costs of constant training of new employees and improving quality of work and thus, increasing efficiency.
The same data suggest employees that change jobs (“Job Switcher”) gain even further in hourly wages. That does not seem to be the case with Field Techs but seem consistent with data for Crew Chiefs and PI/PM wages.
We do not have companies’ retention data to be able to provide informed insights. Anecdotal data suggest that employers are increasingly paying benefits to even temporary, entry level positions – reflecting attempts to retain employees from the onset of employment. But these are just anecdotal data and should be taken as such.
The Twin Cairns Intelligence Units will continue to monitor the sector and publish even more granular, comprehensive reports. These will soon be posted on the Twin Cairns site and could be purchased for nominal fee. We believe that an informed sector can make better decisions about its future, whether it is companies planning their hiring practices or employees negotiating wages and benefits.

Serving the CRM sector with job posts and actionable data.