
CRM Job Report June 2024
TRACKING CRM EMPLOYMENT DATA
By Ran Boytner & Dannee Sevonto
All Copy Rights are Reserved, Twin Cairns Intelligence Unit™
Vol 24 No 6
Updates & News
As we continue to monitor the CRM employment sector, we observed some concerning trends. Wages for field techs did not grow much in recent months. One of the reasons is that qualification requirements and standards slipped dramatically. Of all field tech positions published this month, 22% require only high school education – no college training at all. And, only 23% of field tech job posts require field school training.
This reduction in education and training standards is troubling. The CRM sector keeps field tech wages stagnant by reducing qualifications, “dumbing down” the workforce. The trend should be worrying to stakeholders in the sector as the impact will be profound. Where will we get the next generation of PM/PI’s if those who enter the field have no academic training at all? What is the future role of academia if they do not train the next generation of CRM professionals?
ACRA will be holding its annual meeting on Sep 26-28, and the issue should be a central discussion point. The first meeting of the Airlie House 2 workshop took place in May and was supposed to address – among other issues – the base requirement and standards of the future CRM workforce on public lands. It is crucial that the CRM community learn of the outcome of this meeting and that recommendations made in the small group of invitees there will be published and debated throughout the community (asking for public comments, presentations at ACRA, SAA, etc). The voice of the Registrar of Professional Archaeologists should be made loud and clear, and the RPA position about the changing professional standards should be made public as soon as possible.
These are times of great changes in the CRM sector. Reducing professional standards may be the outcome of such changes, but such trends should be discussed and debated across the community – both providers and consumers of CRM work.
Twin Cairns Performance
This area provides independent data about numbers and access to the Twin Cairns Job Board. It is designed to allow users to evaluate access and ROI when searching for or posting jobs on the Twin Cairns Job Board.
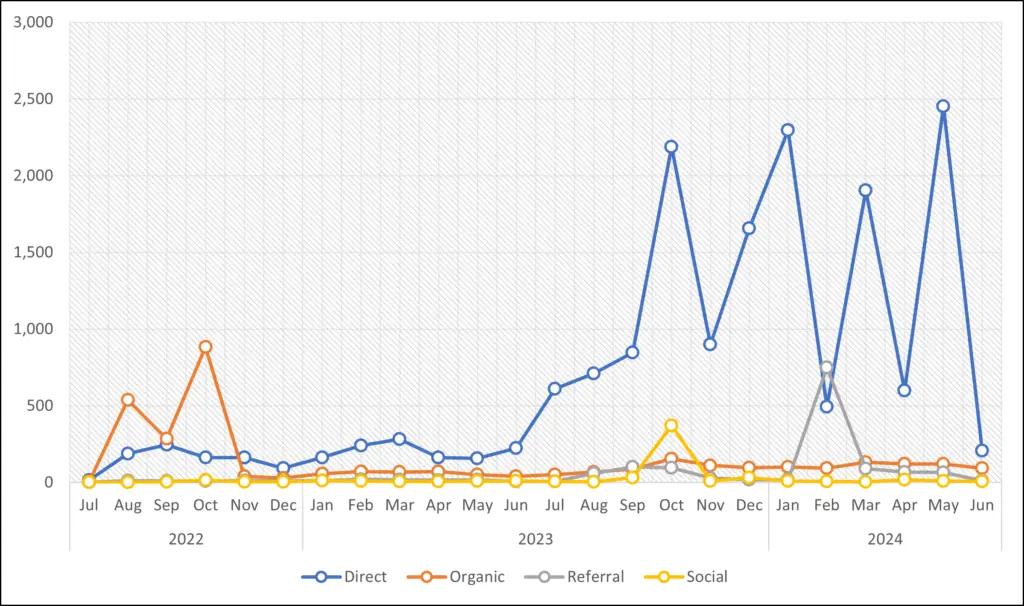
Figure 1: Monthly job views and paths by which users arrived at the Twin Cairns website (Source: Google Analytics)
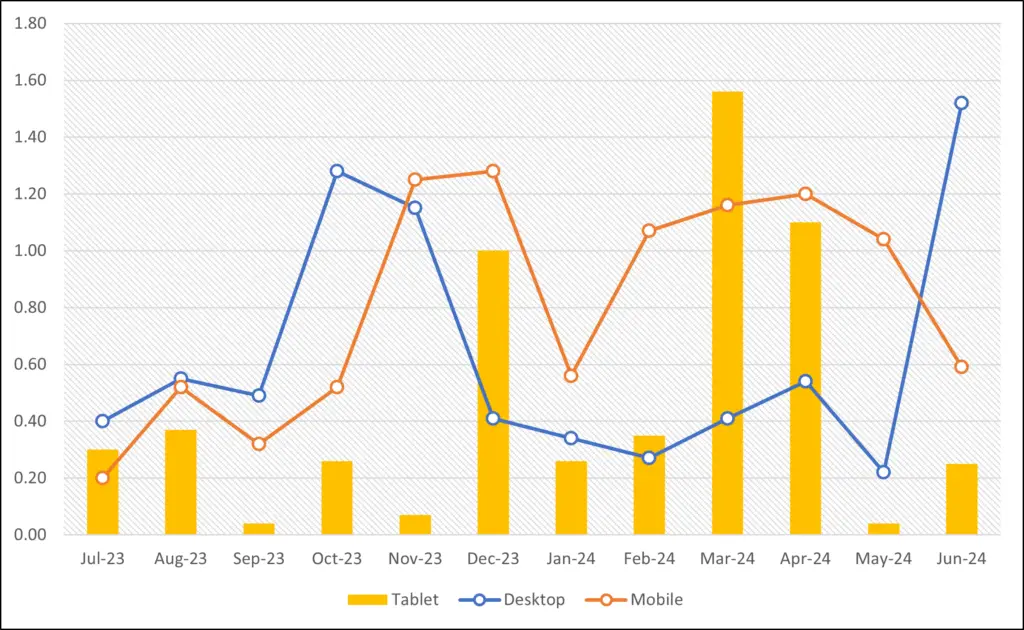
Figure 2: Average time (min) users spend on the Twin Cairns website per session for the past 12 months, by the type of devise used (Source: Google Analytics)
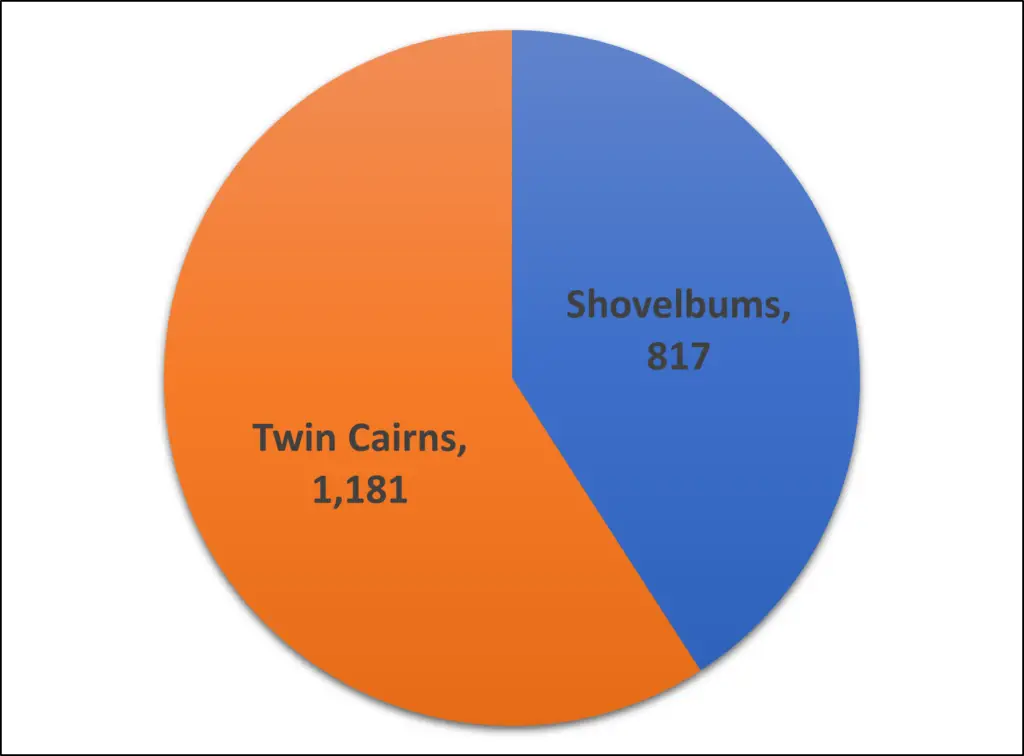
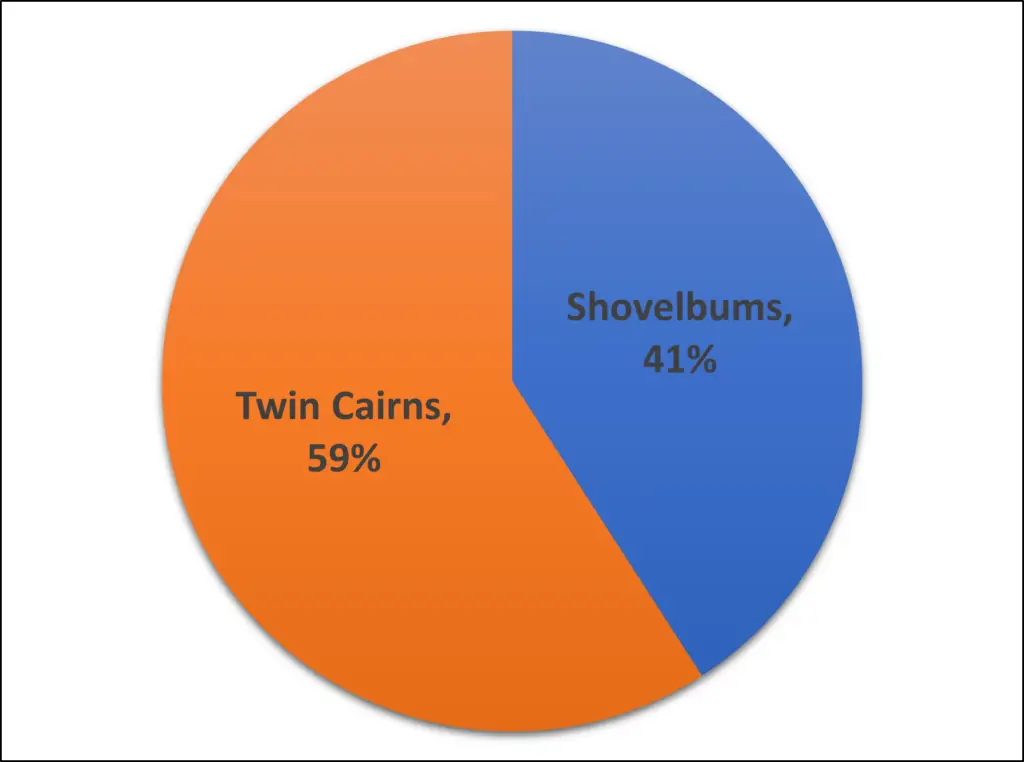
Figure 3: Market share, past 12 months, number of jobs posted (Source: Data from public records at ShovelBums, archaeologyfieldwork.com and Twin Cairns; Data harvested by the Twin Cairns Intelligence Unit™)
Figure 4: Market share as percentage of all job posted, past 12 months (Source: Data from public records at ShovelBums, archaeologyfieldwork.com and Twin Cairns; Data harvested by the Twin Cairns Intelligence Unit™)
Number of Jobs Posted This Month
This area provides data about the number of jobs posts on the leading CRM job boards: Twin Cairns, ShovelBums and archaeologyfieldwork.com. We are aware that Indeed, Monster and other general job boards are used by CRM companies. However, these general job boards are generally used to manage the application process and are not where most employees first learn about a job.
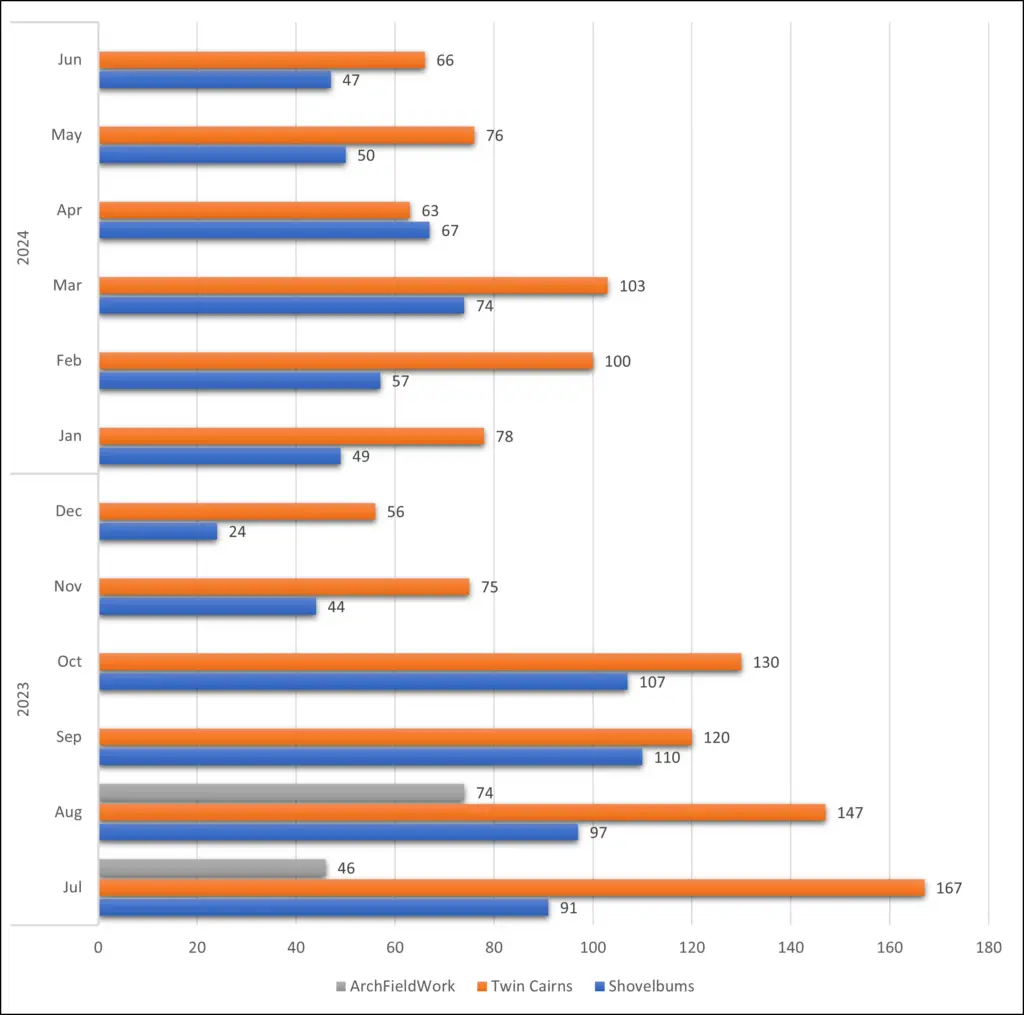
Figure 5: Number of jobs published in the past 12 months by the leading CRM job board sites (Source: Data from public records at ShovelBums, archaeologyfieldwork.com and Twin Cairns; Data harvested by the Twin Cairns Intelligence Unit™)
Job Posts
This area records the number of jobs posted for the past twelve & six months by job type. This data illustrates trends in hiring and demand for specific job types throughout the United States. The term ‘Other’ refers to jobs that do not involve field archaeology but are directly related to CRM (GIS, Lab Technician, Museum Curator, etc).
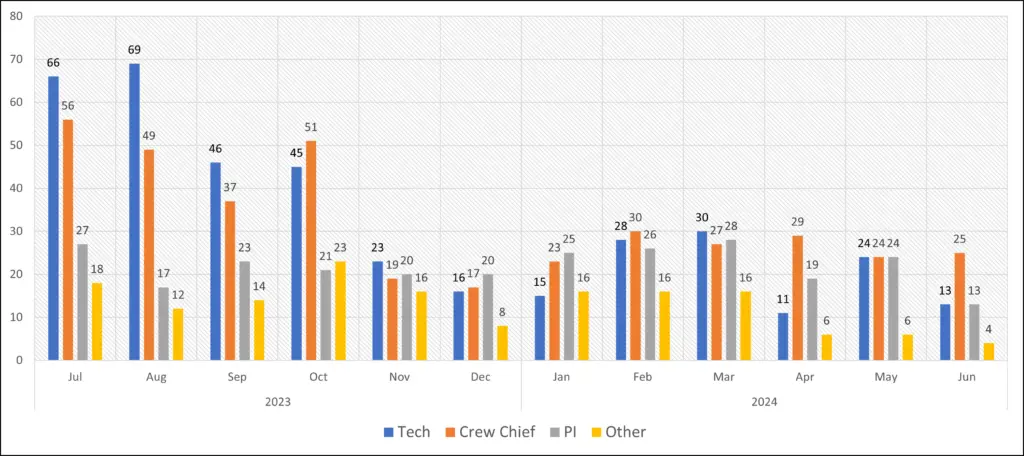
Figure 6: Number of jobs published in the past 12 months by job type (Source: Data from public records at ShovelBums, archaeologyfieldwork.com and Twin Cairns; Data harvested by the Twin Cairns Intelligence Unit™)
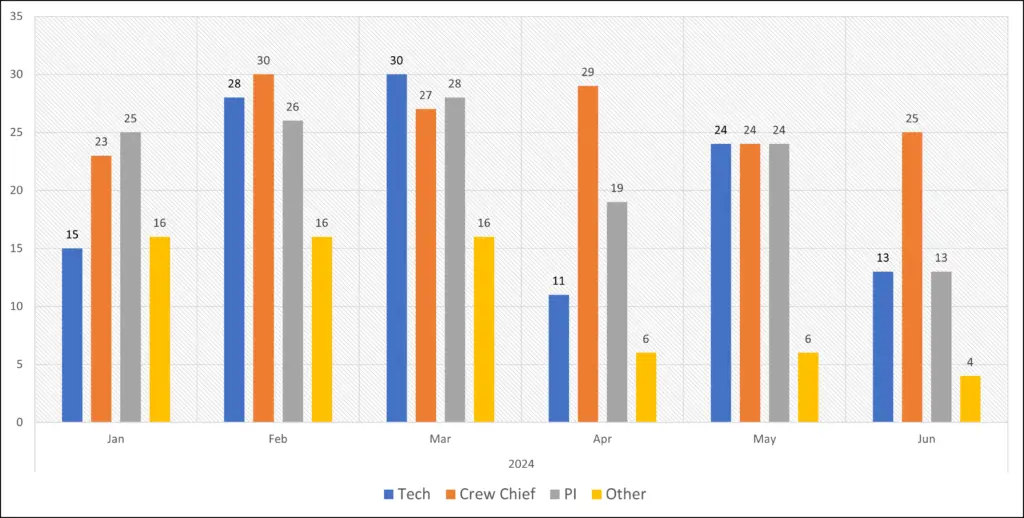
Figure 7: Number of jobs published in the past six months by job type (Source: Data from public records at ShovelBums, archaeologyfieldwork.com and Twin Cairns; Data harvested by the Twin Cairns Intelligence Unit™)
Employer Type
This area provides data about the type of employer hiring within the CRM sector for the past six months. ‘Others’ relate here to the small number of hiring done by nonprofits, museums & universities.
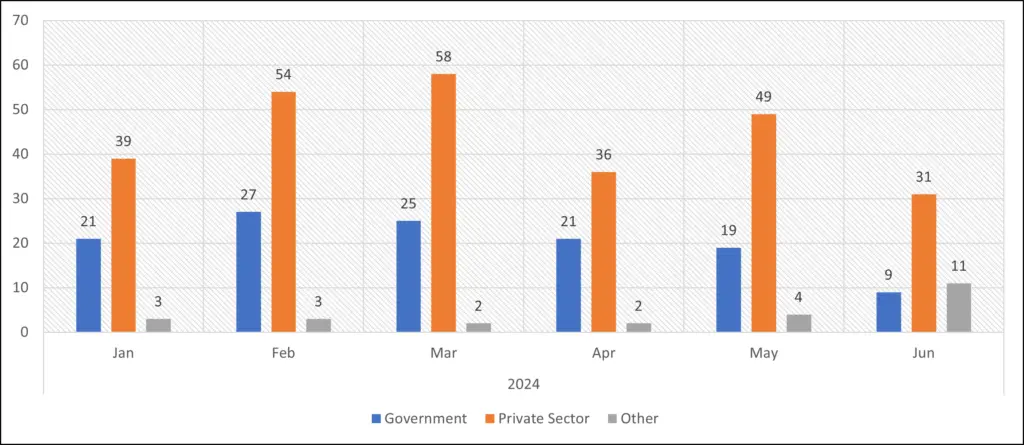
Figure 8: Employer types, for the past six months (Source: Twin Cairns Intelligence Unit™)
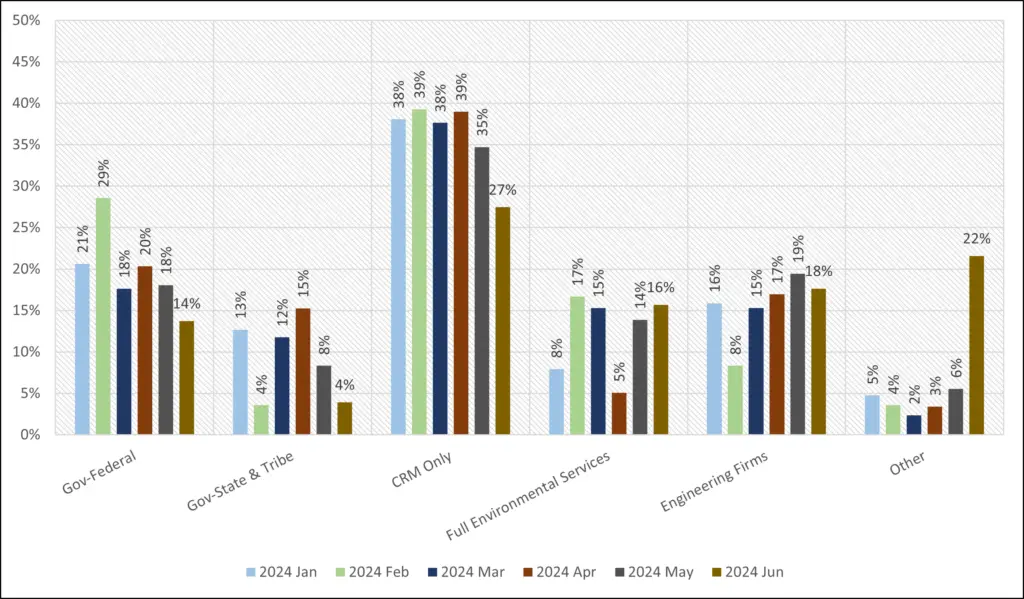
Figure 9: Detailed Employer types for the past six month; ‘Other’ category indicates jobs posted by nonprofits, museums & universities (Source: Twin Cairns Intelligence Unit™)
Position Type
This area presents data documenting duration of employment offered and breaks it down by position type. We are tabulating temporary vs. permanent job offers.
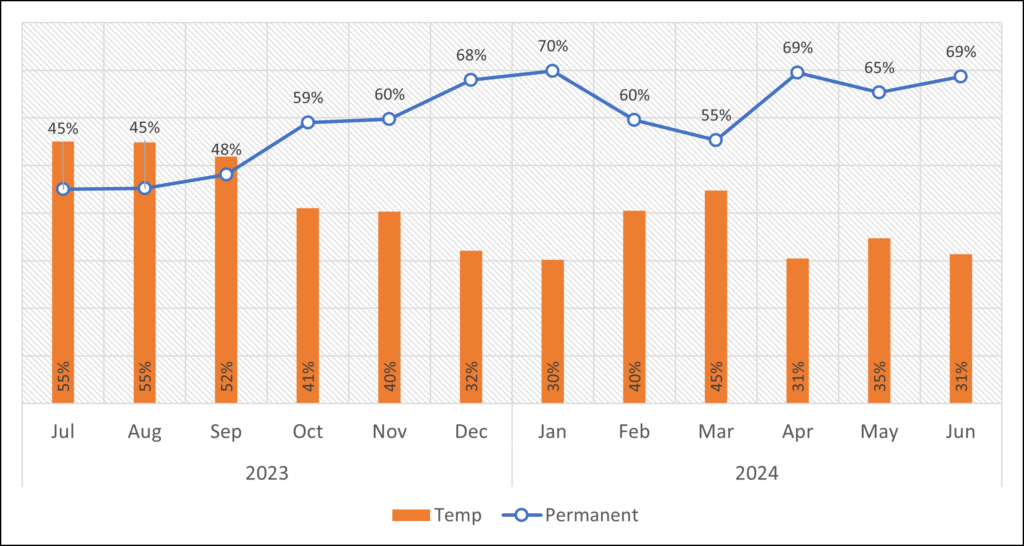
Figure 10: Temp vs permanent positions, past 12 months (Source: Twin Cairns Intelligence Unit™)
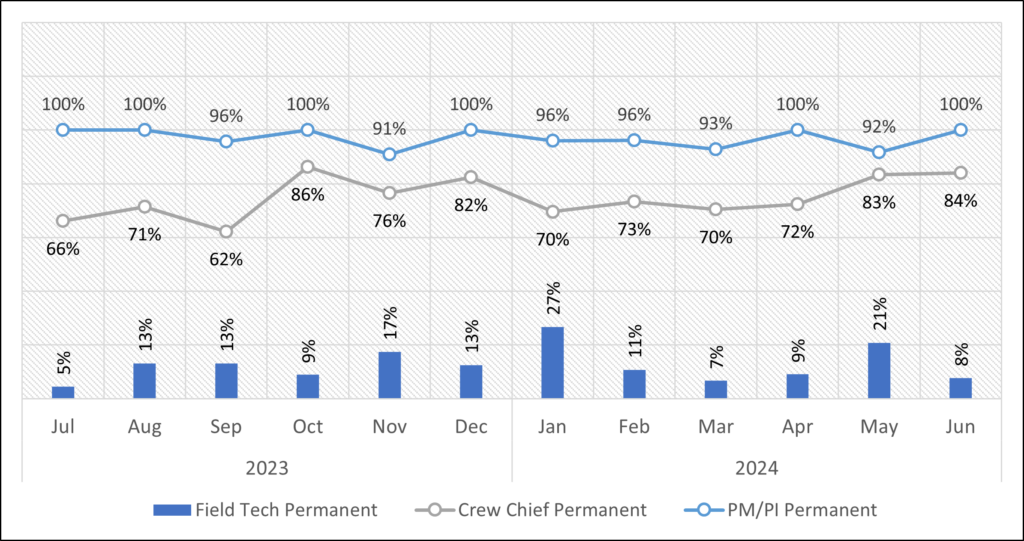
Figure 11: Percentage of permanent positions offered by position type, past 12 months (Source: Twin Cairns Intelligence Unit™)
Wages
This area presents average, maximum, and minimum hourly wages offered to CRM sector employees by position and by employer types. While some employers break down upper field management to Project Managers and Principal investigators, most job posts do not include such distinction. Therefore, we aggregate both categories into one class of employees. ‘Other’ refers to positions offered by nonprofits, museums & universities.
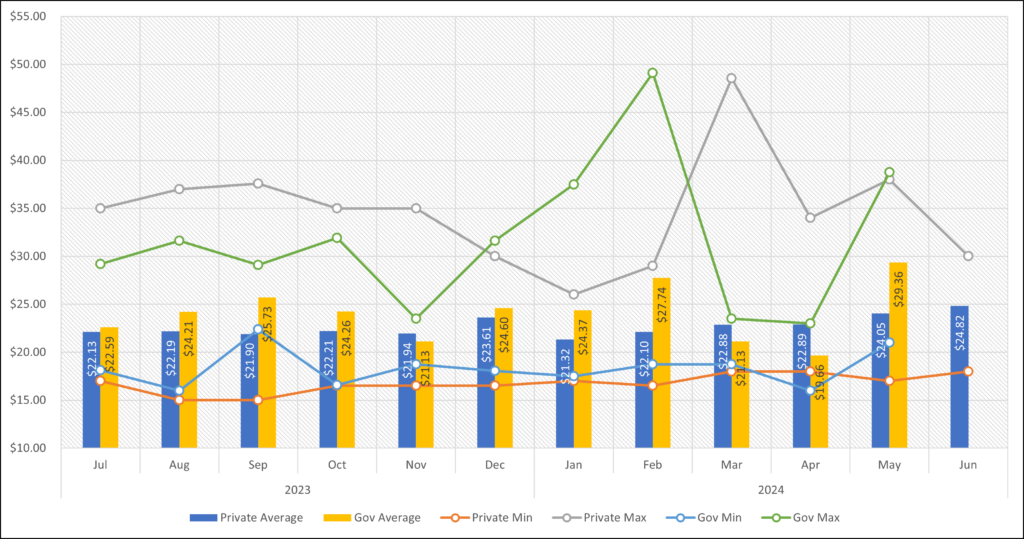
Figure 12: Field Tech hourly wages – average, maximum & minimum – by employer type, past 12 months (Source: Twin Cairns Intelligence Unit™)
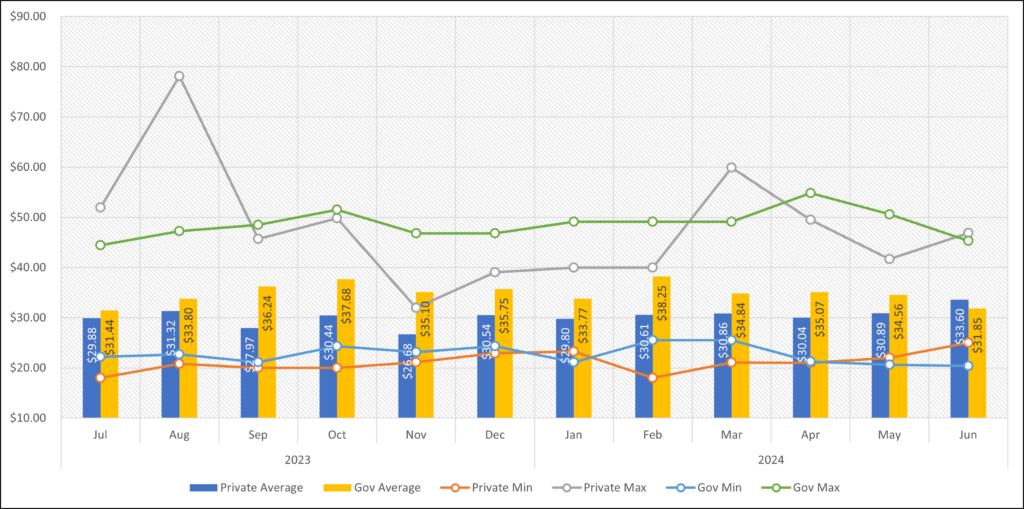
Figure 13: Crew Chief hourly wages – average, maximum & minimum – by employer type, past 12 months (Source: Twin Cairns Intelligence Unit™)
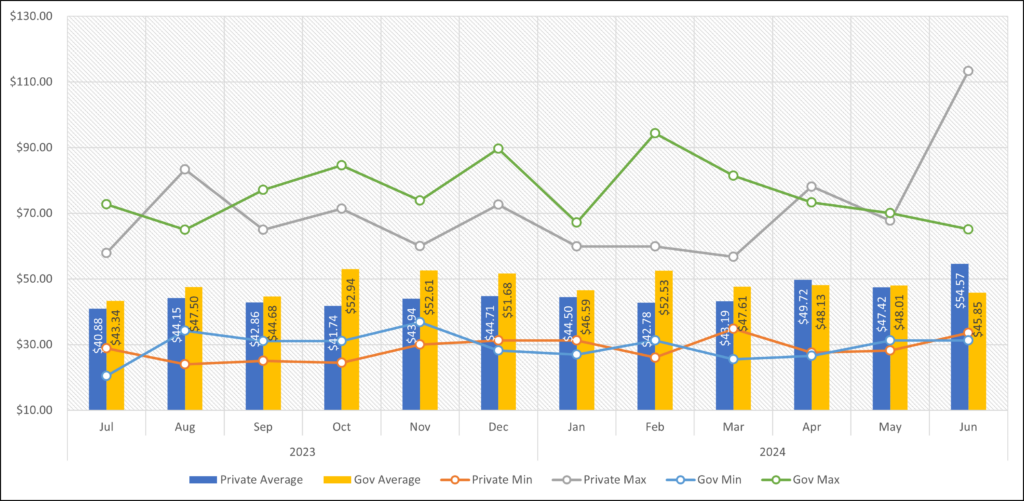
Figure 14: Project Manager/Principal Investigator hourly wages – average, maximum & minimum – by employer type, past 12 months (Source: Twin Cairns Intelligence Unit™)
Published Wage Data
This area presents the publication of wage data and its inclusion in job posts. This area includes data for all job posts, then a breakdown of wage inclusion by position type.
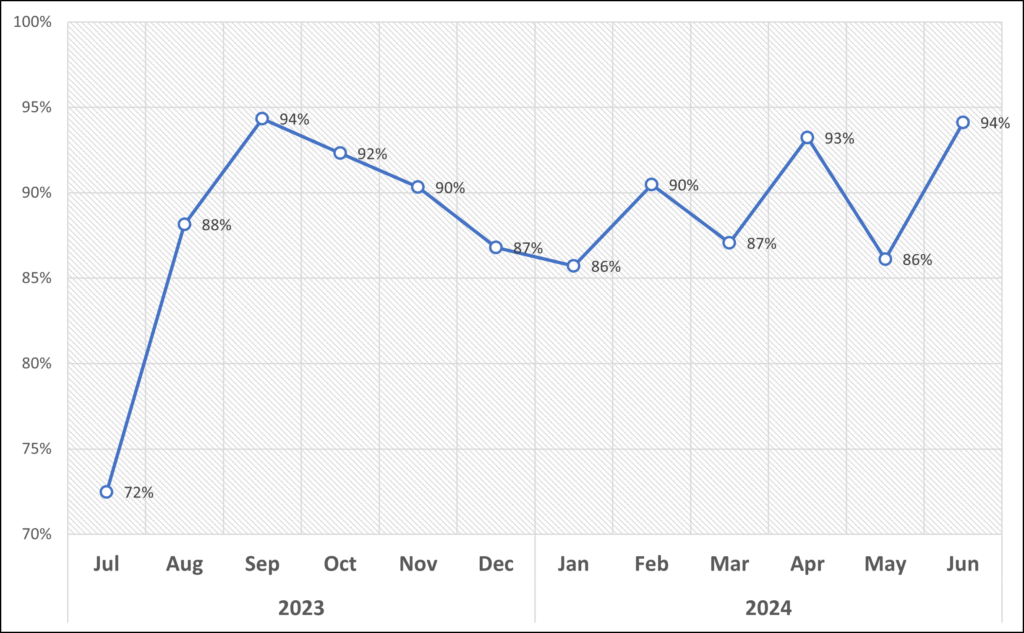
Figure 15: Percentage of all job posts that include wage data, past 12 months (Source: Twin Cairns Intelligence Unit™)
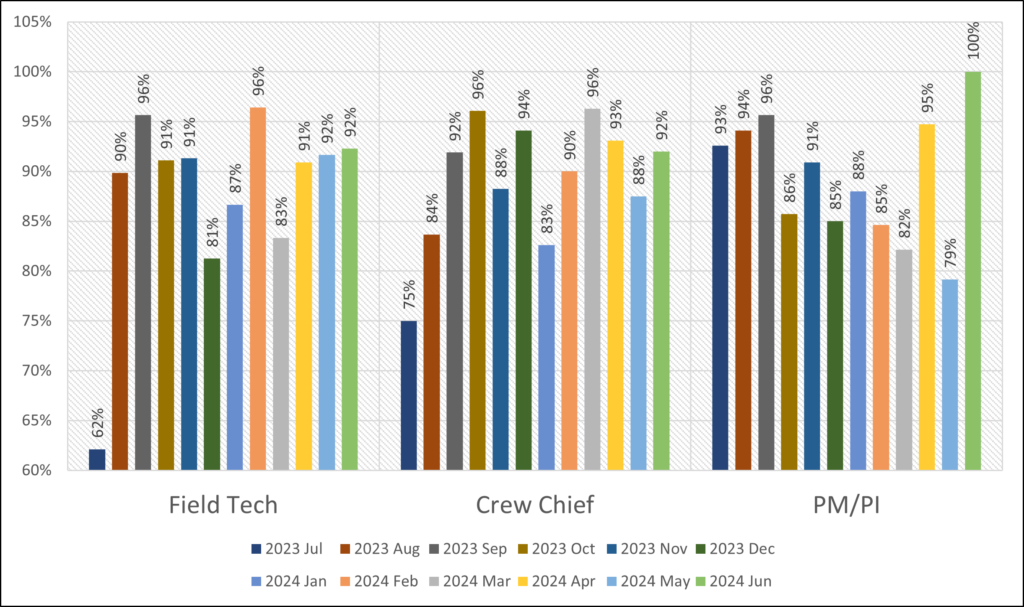
Figure 16: Percentage of job posts that includes wage data by position type, past 12 months (Source: Twin Cairns Intelligence Unit™)
Wage Differentials
This area documents hourly wage differentials between Field Techs and other position types. The area tabulates wage differentials between Field Techs and Crew Chiefs and Field Techs and Project Managers/Principal Investigators.
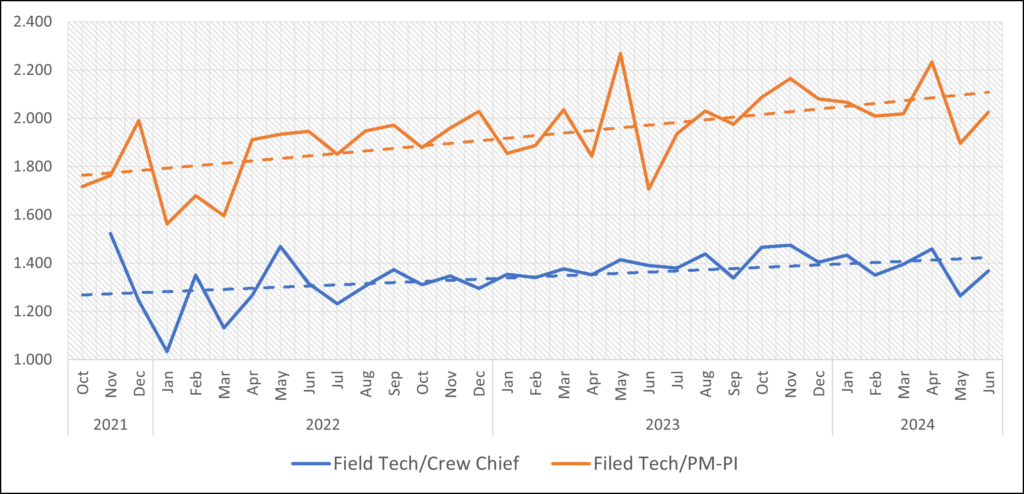
Figure 17: Hourly wage differentials between Field Techs and Crew Chiefs & Field Techs and Project Managers/Principal Investigators (Source: Twin Cairns Intelligence Unit™)
Wage Spread
This area documents the percentage differences between the lowest payment for a specific job to its highest. Typical range for Professionals/Manager is 50% +.
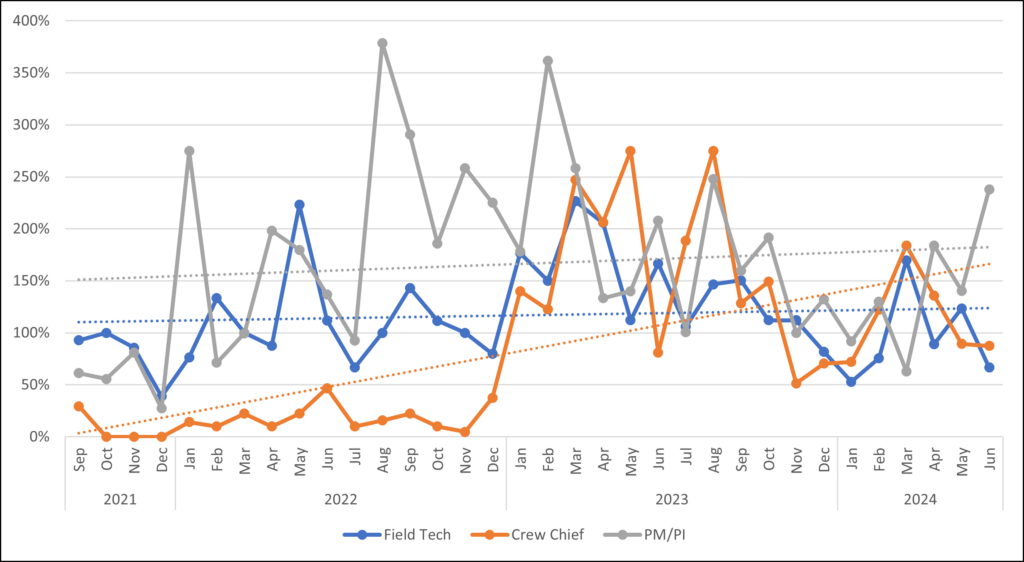
Figure 18: Percentage differences between the lowest & highest wages by position type (Source: Twin Cairns Intelligence Unit™)
Benefits
This area documents the percentage of jobs where employers list benefits as part of the job post. To be considered as offering benefits, the job post must include health insurance and paid days off. Some jobs offer contribution towards retirement plans (401K and similar). If this is the only benefit offered, we list such job posts as not providing benefits to employees.
It is possible that some job posts do not list but offer benefits to employees. Because benefits are not listed on such posts, these posts are tabulated as offering no benefits.
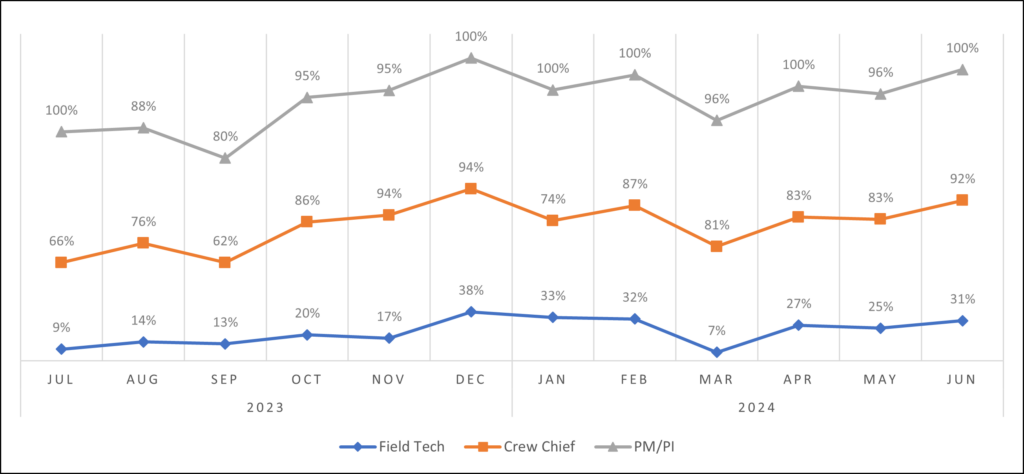
Figure 19: Percentage of jobs posts that offer benefits, by position type, past 12 months (Source: Twin Cairns Intelligence Unit™)
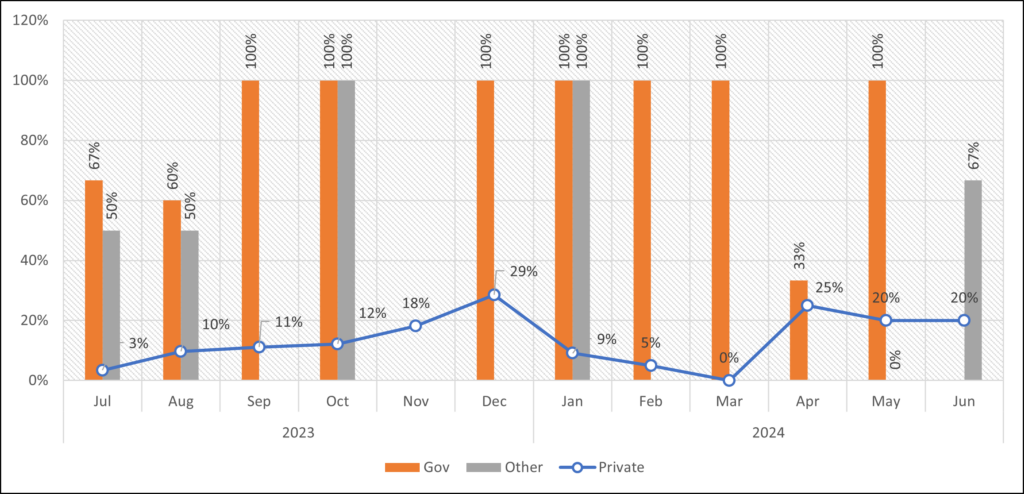
Figure 20: Percentage of Field Tech positions offered with benefits, by employer type, past 12 months (Source: Twin Cairns Intelligence Unit™)
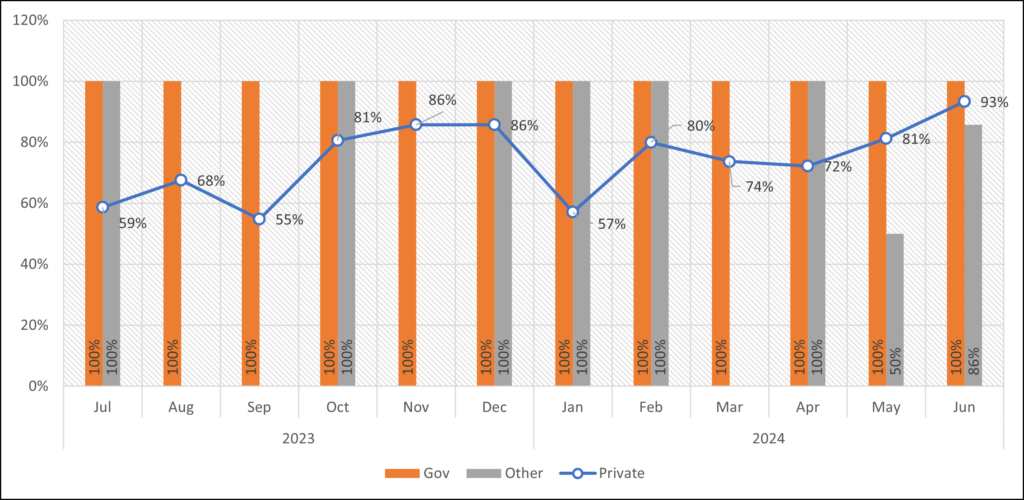
Figure 21: Percentage of Crew Chief positions offered with benefits, by employer type, past 12 months (Source: Twin Cairns Intelligence Unit™)
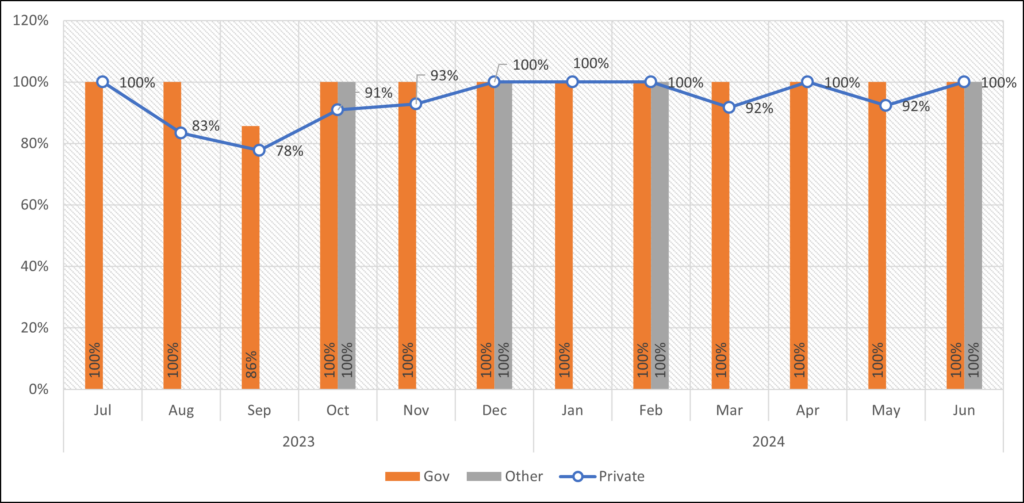
Figure 22: Percentage of Project Managers/Principal Investigator positions offered with benefits, by employer type, past 12 months (Source: Twin Cairns Intelligence Unit™)
Formal Education Requirements
This area presents data on formal education requirements for the CRM sector. First, we document education requirements for the sector. Then, we break down education requirements by position type.
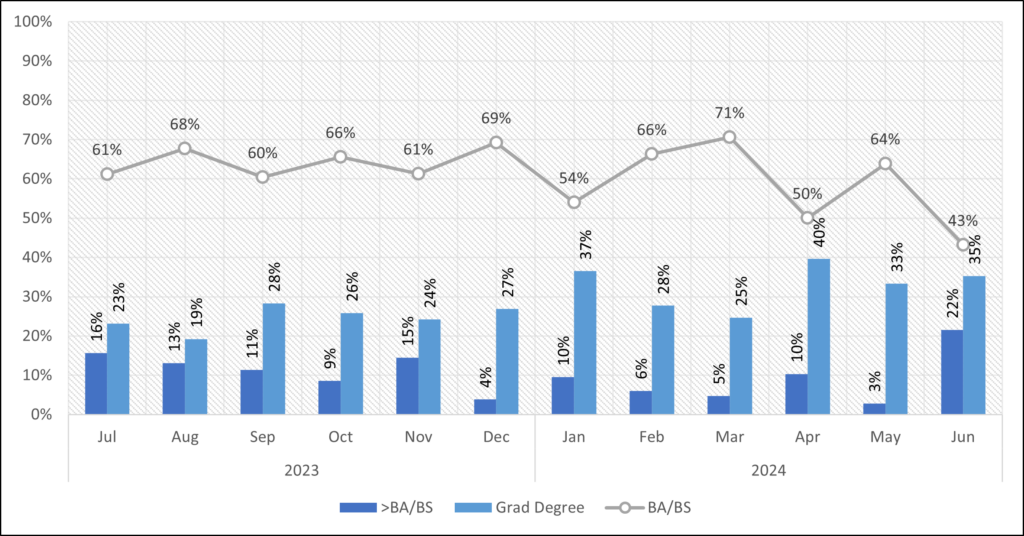
Figure 23: Formal education requirements across the CRM sector, past 12 months (Source: Twin Cairns Intelligence Unit™)
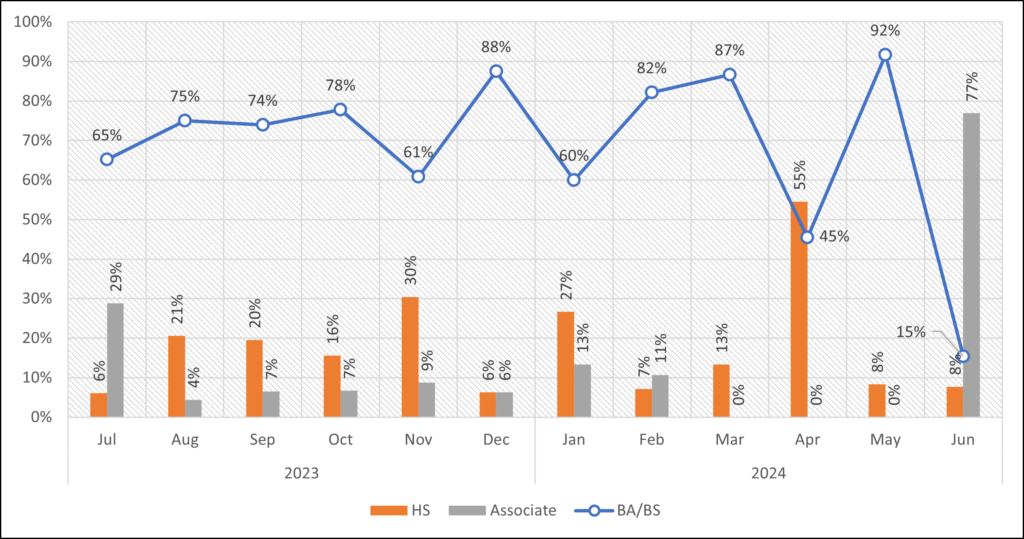
Figure 24: Formal education requirements for Field Techs, past 12 months (Source: Twin Cairns Intelligence Unit™)
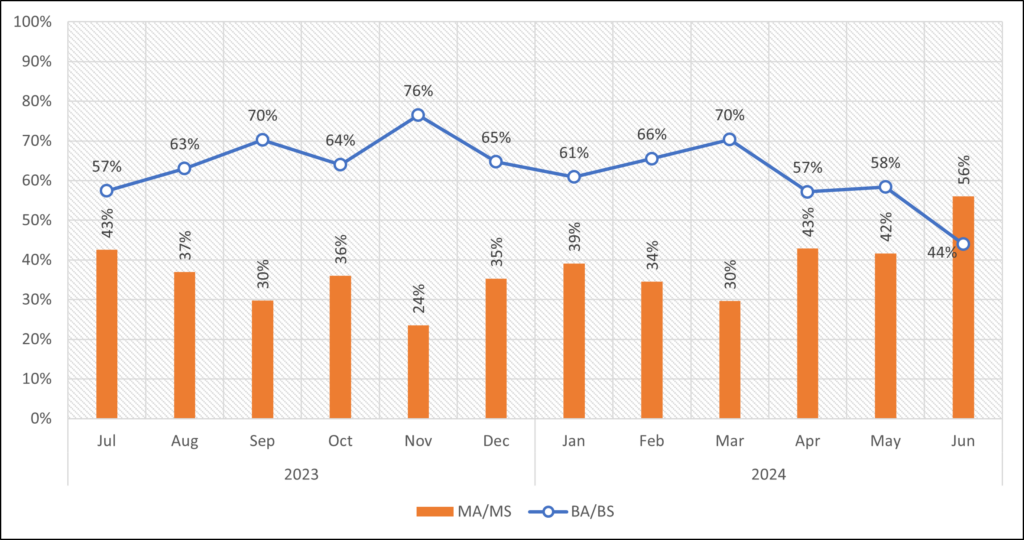
Figure 25: Formal education requirements for Crew Chiefs, past 12 months (Source: Twin Cairns Intelligence Unit™)
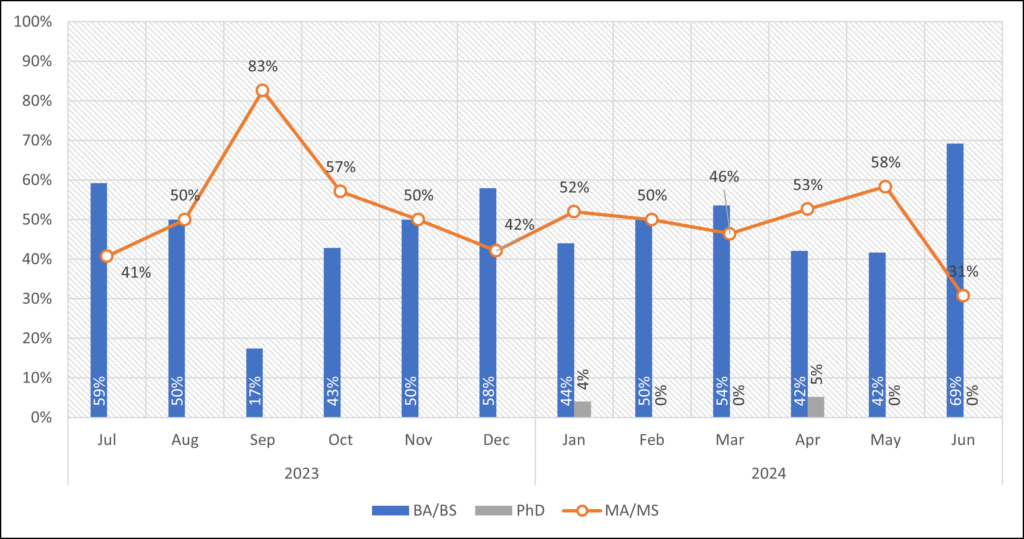
Figure 26: Formal education requirements for Project Managers/Principal Investigators, past 12 months (Source: Twin Cairns Intelligence Unit™)
Field School Requirement for Field Techs
This area documents the requirement of a field school as a condition of employment for Field Techs. It first documents the field school requirement for the sector as a whole and then breaks it down by employer type. Regional data is tabulated in our Quarterly Reports.
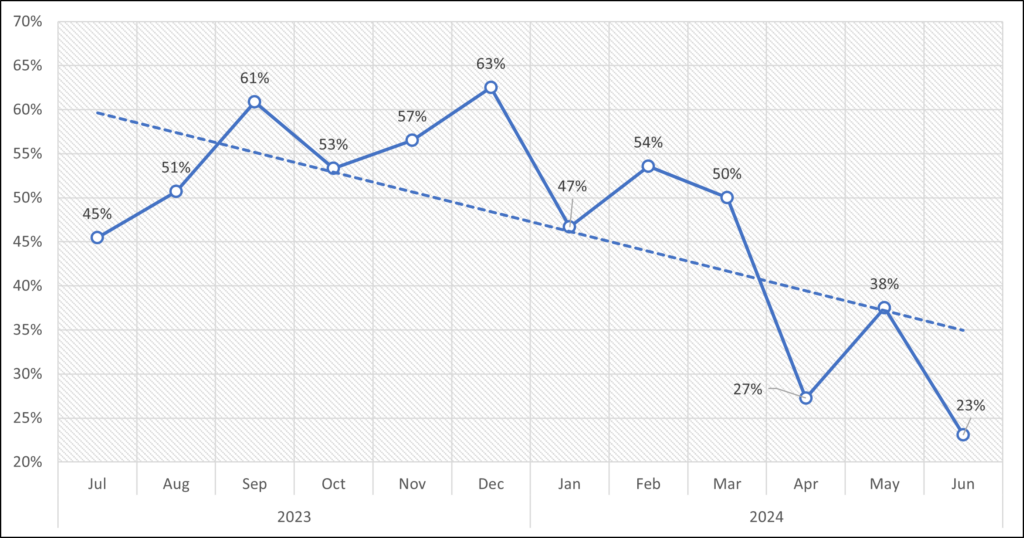
Figure 27: Sector wide field school requirement as condition of employment for Field Techs, past 12 months (Source: Twin Cairns Intelligence Unit™)
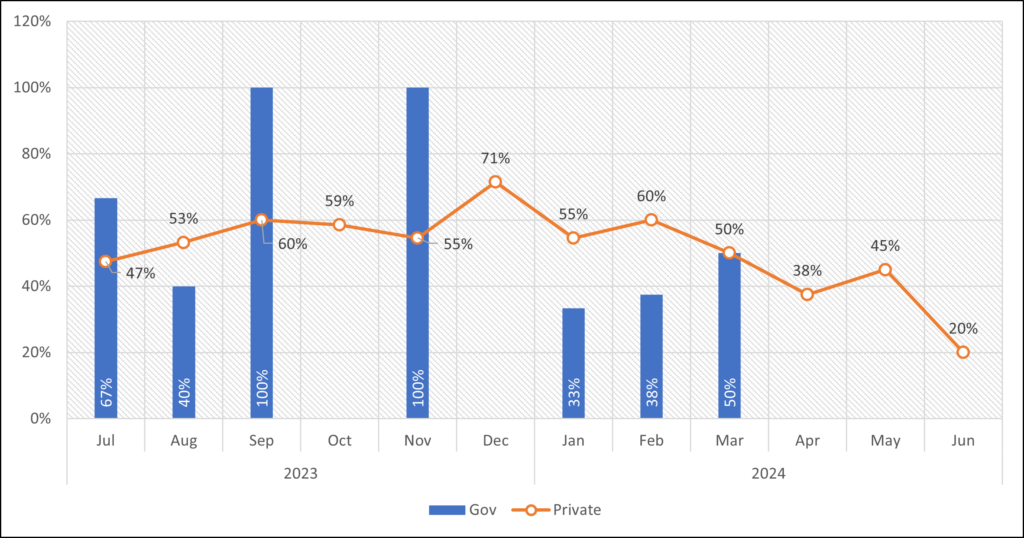
Figure 28: Field school requirement for Field Techs, by employer type, past 12 months (Source: Twin Cairns Intelligence Unit™)
Demographic Data
This area provides gender and age distribution of users coming to the Twin Cairns site. On Average, gender is available for less than 10% of visitors and is provided only as a binary male/female designation. Age, on average, is provided for 15% of visitors. Because the data reflect such a small portion of the visitors to the site, use with extreme caution.
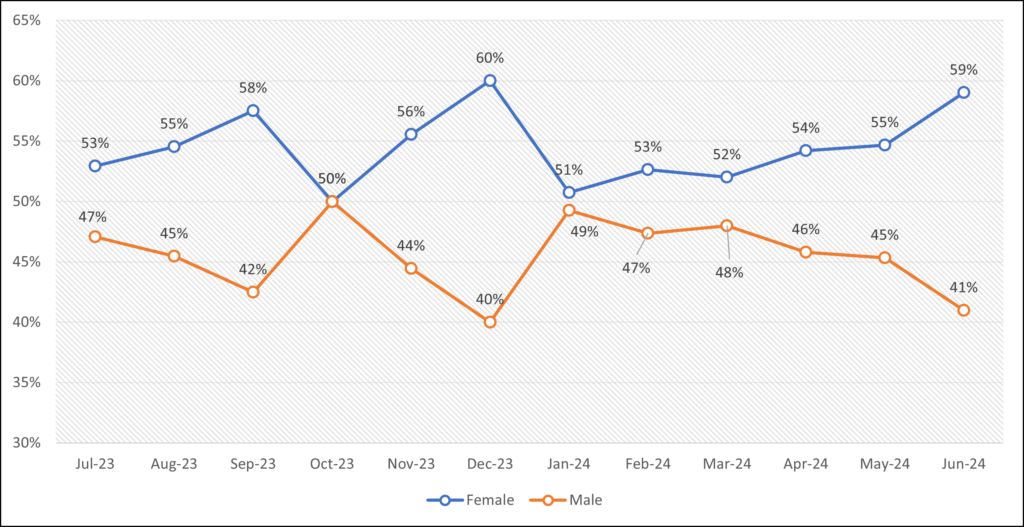
Figure 29: Gender distribution among visitors to the Twin Cairns website (Source: Google Analytics)
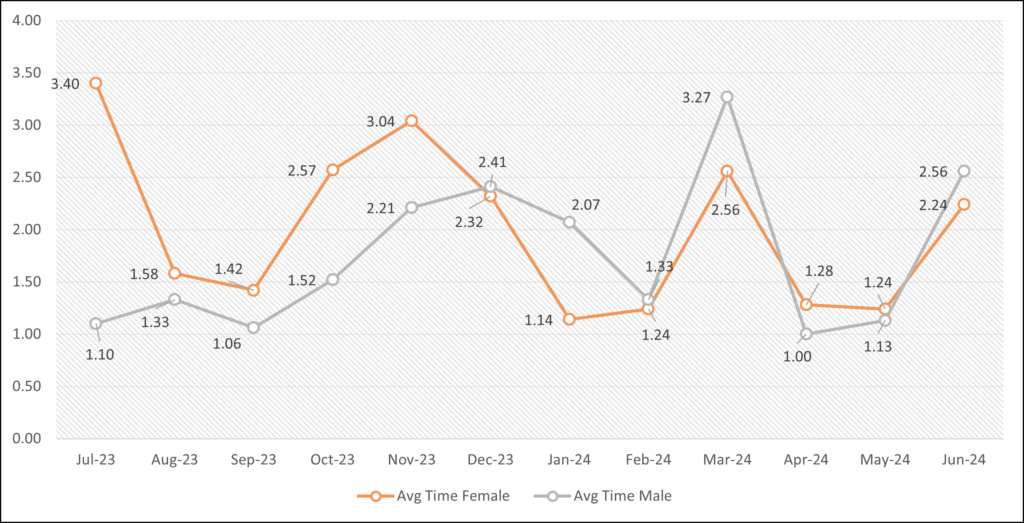
Figure 30: Average time (min) male & female visitors spend on the Twin Cairns website (Source: Google Analytics)
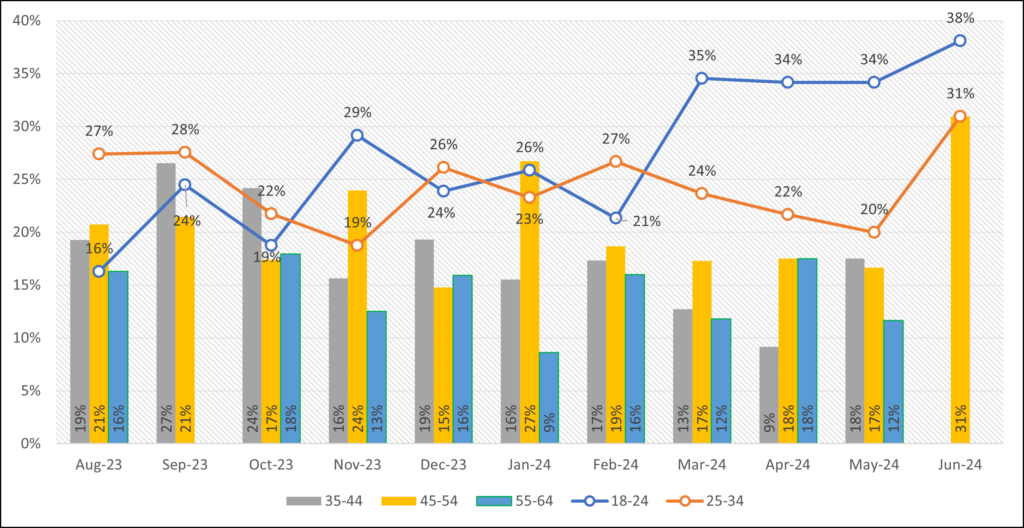
Figure 31: Age band distribution among visitors to the Twin Cairns website (Source: Google Analytics)
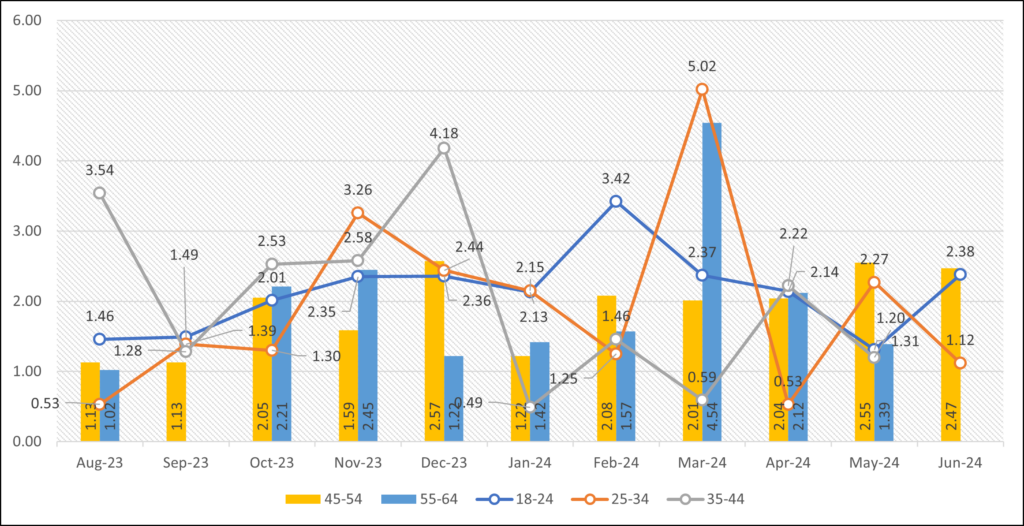
Figure 32: Average time (min) visitors of different age bands spend on the Twin Cairns website (Source: Google Analytics)